Data Analytics & Power BI Dashboard Company in Dubai
هندسة البيانات ولوحات المعلومات
Data analytics and Power BI dashboards: one number everyone trusts, instead of four departments arguing about whose export is right.
رقم واحد تثق به كل الأقسام، بدل أربعة تقارير تتجادل حول أيّها الصحيح.
The problem
Sales reports one revenue figure, finance reports another, and the weekly meeting is spent reconciling rather than deciding.
What does a data analytics engagement with Brolly.ae deliver?
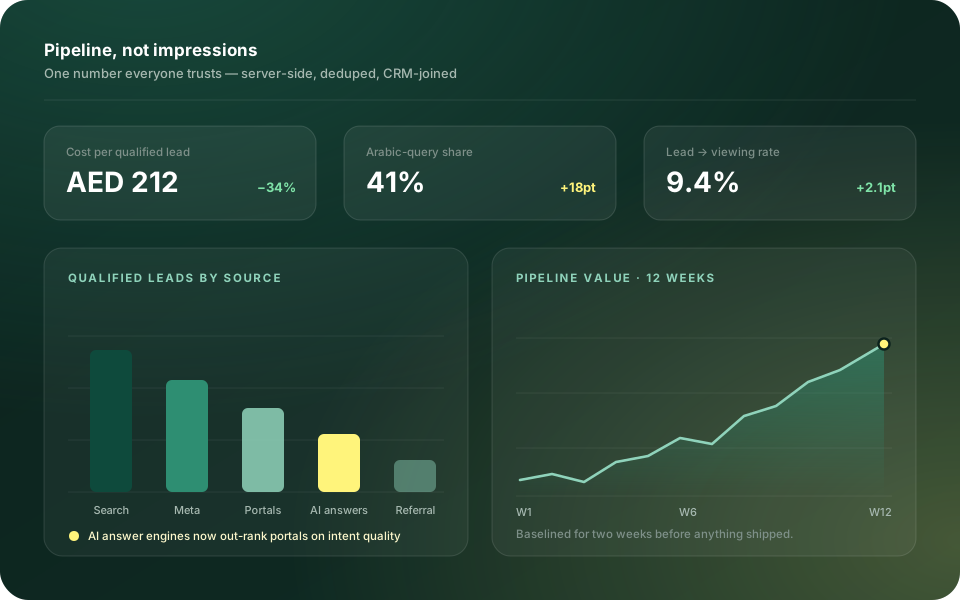
One number everyone trusts. Brolly.ae builds pipelines from CRM, advertising, ERP, POS and spreadsheets into a single warehouse, agrees each definition once and enforces it in code, then delivers executive dashboards in Power BI or Looker Studio with operational views per team, automated alerts and marketing attribution wired to real revenue — live in six to ten weeks for a Dubai business.
Last reviewed · Brolly.ae editorial team
Data Engineering & Dashboards at a glance
| Sources | CRM, ad platforms, ERP, POS, e-commerce, spreadsheets |
|---|---|
| Warehouse and modelling | BigQuery or Postgres, with dbt for definitions enforced in code; Airbyte for ingestion |
| Dashboards | Power BI, Looker Studio or Metabase — executive views plus one operational view per team |
| Definitions | Agreed once, written down, enforced in the model — so sales and finance report the same revenue figure |
| Attribution | Wired to CRM-qualified leads and closed revenue, not platform-reported conversions |
| Timeline | 6–10 weeks |
| Pricing | Fixed price per phase, quoted in AED, excluding 5% VAT |
What we actually build
- Data engineering: pipelines from CRM, ads, ERP, POS and spreadsheets into one warehouse
- Definitions agreed once and enforced in code
- Executive Power BI or Looker Studio dashboards plus operational views per team
- Automated alerts when a metric moves beyond a threshold
- Marketing attribution wired to real revenue, not platform-reported conversions
- Decisions made on one source of truth
- Manual reporting time near zero
- Attribution you'd defend in a board meeting
We baseline these before the build starts. Without a before, the after is just a claim.
Data Engineering & Dashboards: the questions buyers ask first
Short answers, written to stand on their own — including the ones with an uncomfortable answer.
Because each exports from a different system with a different definition — booked versus invoiced versus collected, gross versus net of VAT, this month versus this period. A dashboard on top of two exports reproduces the argument. The fix is a warehouse where each definition is agreed once and enforced in code, so every view reads from the same model.
Power BI where the organisation runs on Microsoft 365 and needs row-level security and governed datasets; Looker Studio where the sources are mostly Google — Ads, Analytics, Sheets — and the audience is marketing; Metabase where a lean team wants self-serve SQL without licensing. The warehouse and definitions underneath are the same in each case, so the choice is about who reads it.
Yes, through their APIs or scheduled exports where an API does not exist — Zoho, Odoo, SAP and Tally are the usual ones in the UAE, alongside Shopify and the ad platforms. Discovery establishes which connector each source needs and where the definitions differ between systems, which is where the real work is.
Platform-reported conversions are replaced with CRM truth: leads are matched to their source, qualified or disqualified in the CRM, and closed revenue is attributed back to channel and campaign. Server-side tracking and offline conversion import feed the same numbers back to the ad platforms so they optimise toward qualified leads rather than form fills.
Six to ten weeks for the pipeline, the agreed definitions and the first executive and operational views. The definitions workshop is usually the longest step and the one that cannot be skipped: a dashboard built before the numbers are agreed is a faster way to have the same argument.
More ai & automation
AI Agents & Assistants
وكلاء ومساعدو الذكاء الاصطناعيAI agents and chatbots that answer, qualify and act — on WhatsApp, web chat, email and inside your CRM.
ExploreWorkflow & Process Automation
أتمتة العمليات وسير العملBusiness process automation for the unglamorous wiring: quotes, invoices, approvals, onboarding, reporting — running themselves.
ExploreCustom AI Development
تطوير حلول ذكاء اصطناعي مخصّصةCustom AI solutions when off-the-shelf doesn't fit: bespoke models, RAG systems and AI features inside your own product.
ExploreStart with a two-week discovery sprint.
Paid, fixed-price, and yours to keep — the scope, architecture note and quote are useful whether or not we build it.